“It’s time to start the countdown to the crash of 2016. No, this is not a prediction of a minor correction. Plan on a 50% crash,” writes economist Paul B. Farrell for MarketWatch. He continues, “Maybe not till we get a bit closer to the presidential election cycle of 2016. But a crash is a sure bet, it’s guaranteed certain: Complete with echoes of the 2008 crash, which impacted on the GOP election results, triggering a $10 trillion loss of market cap … like the 1999 dot-com collapse, it’s post-millennium loss of $8 trillion market cap, plus a 30-month recession … moreover a lot like the 1929 crash and the long depression that followed.”
The National Inflation Association just published article illustrating just how overvalued the global markets are:
NIA has calculated the monthly market cap/GDP ratio of 24 major countries going back to 1991, which best indicates how undervalued/overvalued its stock market is being valued. To make it easier to compare the market cap/GDP ratios of multiple nations and to calculate the overall valuation of the global stock market – we converted each country’s historical market cap/GDP ratios into percentiles of 0% to 100%. (100% means its market cap/GDP ratio is at its highest level in history vs. 0% the lowest in history).NIA considers a country’s stock market to be overvalued when its market cap/GDP ratio percentile is above 75%, and extremely overvalued when above 90%. Currently, the US has a market cap/GDP ratio percentile of 95.56%. This means that over the last 293 months dating back to the beginning of 1991, the US stock market was more overvalued than today during just 13 of those months.
Unbelievably, 19 or 79.17% of the 24 countries tracked by NIA now have stock markets that are overvalued, with 14 of those or 58.33% overall being extremely overvalued. In fact, 12 or 50% of the 24 countries tracked by NIA currently have market cap/GDP ratio percentiles of 95% or above. The median country tracked by NIA has a market cap/GDP ratio percentile today of 93.69%.
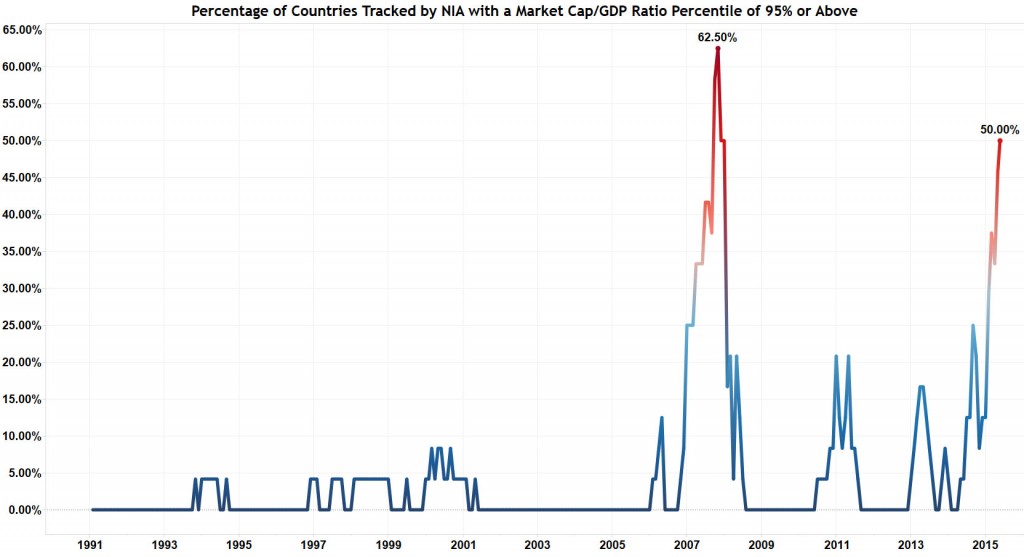
Japan and South Africa currently have their highest market cap/GDP ratios in history with percentiles of 100%. Hong Kong, Taiwan, South Korea, Canada, Indonesia, Mexico, China, Thailand, Singapore, along with the US – also currently have market cap/GDP ratio percentiles of 95% or above. Historically, the only time in history when over 50% of the countries tracked by NIA had market cap/GDP ratio percentiles north of 95% was in late-2007. This lasted for a total of only two months. In October 2007, a peak of 15 or 62.5% of the nations tracked by NIA had market cap/GDP ratio percentiles of above 95% vs. 12 or 50% today.
Clearly, the global stock market is nearing a peak – and current valuations will be impossible to sustain. After the global median market cap/GDP ratio percentile peaked in October 2007 at 97.44%, it fell to 81.4% within the following three months and ultimately crashed to a low in February 2009 of 26.45%. The next crash could be far more devastating.